Monthly Archives: August 2018

highcharts php array

https://www.freeformatter.com/json-formatter.html


$chart = '

  {
   "title": {
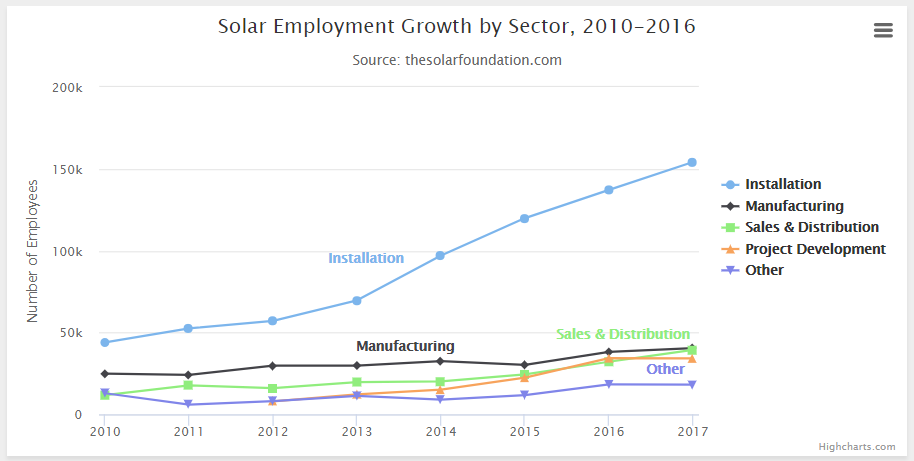
      "text": "Solar Employment Growth by Sector, 2010-2016"
   },
   "subtitle": {
      "text": "Source: thesolarfoundation.com"
   },
   "yAxis": {
      "title": {
         "text": "Number of Employees"
      }
   },
   "legend": {
      "layout": "vertical",
      "align": "right",
      "verticalAlign": "middle"
   },
   "plotOptions": {
      "series": {
         "label": {
            "connectorAllowed": false
         },
         "pointStart": 2010
      }
   },
   "series": [
      {
         "name": "Installation",
         "data": [
            43934,
            52503,
            57177,
            69658,
            97031,
            119931,
            137133,
            154175
         ]
      },
      {
         "name": "Manufacturing",
         "data": [
            24916,
            24064,
            29742,
            29851,
            32490,
            30282,
            38121,
            40434
         ]
      },
      {
         "name": "Sales & Distribution",
         "data": [
            11744,
            17722,
            16005,
            19771,
            20185,
            24377,
            32147,
            39387
         ]
      },
      {
         "name": "Project Development",
         "data": [
            null,
            null,
            7988,
            12169,
            15112,
            22452,
            34400,
            34227
         ]
      },
      {
         "name": "Other",
         "data": [
            12908,
            5948,
            8105,
            11248,
            8989,
            11816,
            18274,
            18111
         ]
      }
   ],
   "responsive": {
      "rules": [
         {
            "condition": {
               "maxWidth": 500
            },
            "chartOptions": {
               "legend": {
                  "layout": "horizontal",
                  "align": "center",
                  "verticalAlign": "bottom"
               }
            }
         }
      ]
   }
}
        ';

//$json = json_decode($chart, $assoc=true);
// echo '
';
   // var_export($json);
   // echo '

';
// exit();

Share

Remove GeoJSON datasource as well as entities

// 1. we can save the references to the entities that are labels in an array called 'labels'
var labels = [];


var promise = Cesium.GeoJsonDataSource.load('../../../cesiumLayers/sampledata/nextgen/World_Lables.geojson');
promise.then(function (dataSource) { 
    //viewer.dataSources.add(dataSource); 
    var entities = dataSource.entities.values; 

    for (var i = 0; i < entities.length; i++) { 
        var entity = entities[i]; 
        var abc = entity.position.getValue(); 
        var stPt = convertCartesianToCartographic(abc); 
        //entity.position = Cesium.Cartesian3.fromDegrees(stPt[0],stPt[1],stPt[2]); 

        // 2. Now, push each entity that's a label to our 'labels' array
        labels.push(viewer.entities.add({ 
            position: Cesium.Cartesian3.fromDegrees(stPt[0], stPt[1], stPt[2]), 
            label: { 
                text: entity.properties.name, 
                font: '16px Helvetica', 
                fillColor: Cesium.Color.WHITE, 
                outlineColor: Cesium.Color.BLACK, 
                outlineWidth: 5, 
                //pixelOffset : new Cartesian3(50.0, -50.0), 
                style: Cesium.LabelStyle.FILL_AND_OUTLINE, 
                translucencyByDistance: new Cesium.NearFarScalar(2.5e6, 1.0, 2.5e7, 0.0) 
            } 
        })); 
    } 
});

// some code later...

for (var i = 0; i < labels.length; i++) {
    // remove each entity that's a label
    viewer.entities.remove(labels[i]);
}
Share

cesiumjs – Removing Polyline


https://groups.google.com/forum/#!msg/cesium-dev/Bf9MwBgJN8w/5WfUFprBqSgJ

https://stackoverflow.com/questions/34450497/removing-polyline-in-cesium-js  Used

https://groups.google.com/forum/#!msg/cesium-dev/SLGGF3kpp_4/MvLRLVku42AJ

https://developers.google.com/web/fundamentals/primers/promises

Share

GeoJSON FeatureCollection example, geometry and properties.

        $str = '{
            "type": "FeatureCollection",
            "features": [
            {
                "type": "Feature",
                "geometry": {
                    "type": "Polygon",
                    "coordinates": [[[-69.0062266588211,
                    9.27562217679211],
                    [-43.517945408821106,
                    -2.811371193331128],
                    [-37.014039158821106,
                    -9.795677582829732],
                    [-72.61157142049046,
                    4.701436497353403],
                    [-69.0062266588211,
                    9.27562217679211]]]
                },
                "properties": {
                    "name": "DOUBLE OAKS CENTER",
                    "address": "1326 WOODWARD AV"
                }
            },
            {
                "type": "Feature",
                "geometry": {
                    "type": "Point",
                    "coordinates": [
                        -80.837753,
                        35.249801
                    ]
                },
                "properties": {
                    "name": "DOUBLE OAKS CENTER",
                    "address": "1326 WOODWARD AV"
                }
            }
            ]
        }';

http://openlayers.org/en/master/examples/geojson.html
https://google-developers.appspot.com/maps/documentation/utils/geojson/
http://geojsonlint.com/

https://gist.github.com/sgillies/1233327  –  The GeoJSON Format Specification

var viewer = new Cesium.Viewer('cesiumContainer', {
    sceneMode : Cesium.SceneMode.SCENE2D,
    timeline : false,
    animation : false
});

var dataSource = Cesium.GeoJsonDataSource.load('simplestyles.geojson');
viewer.dataSources.add(dataSource);
viewer.zoomTo(dataSource);

Share