Category Archives: cesiumjs

Remove GeoJSON datasource as well as entities

// 1. we can save the references to the entities that are labels in an array called 'labels'
var labels = [];


var promise = Cesium.GeoJsonDataSource.load('../../../cesiumLayers/sampledata/nextgen/World_Lables.geojson');
promise.then(function (dataSource) { 
    //viewer.dataSources.add(dataSource); 
    var entities = dataSource.entities.values; 

    for (var i = 0; i < entities.length; i++) { 
        var entity = entities[i]; 
        var abc = entity.position.getValue(); 
        var stPt = convertCartesianToCartographic(abc); 
        //entity.position = Cesium.Cartesian3.fromDegrees(stPt[0],stPt[1],stPt[2]); 

        // 2. Now, push each entity that's a label to our 'labels' array
        labels.push(viewer.entities.add({ 
            position: Cesium.Cartesian3.fromDegrees(stPt[0], stPt[1], stPt[2]), 
            label: { 
                text: entity.properties.name, 
                font: '16px Helvetica', 
                fillColor: Cesium.Color.WHITE, 
                outlineColor: Cesium.Color.BLACK, 
                outlineWidth: 5, 
                //pixelOffset : new Cartesian3(50.0, -50.0), 
                style: Cesium.LabelStyle.FILL_AND_OUTLINE, 
                translucencyByDistance: new Cesium.NearFarScalar(2.5e6, 1.0, 2.5e7, 0.0) 
            } 
        })); 
    } 
});

// some code later...

for (var i = 0; i < labels.length; i++) {
    // remove each entity that's a label
    viewer.entities.remove(labels[i]);
}
Share

cesiumjs – Removing Polyline


https://groups.google.com/forum/#!msg/cesium-dev/Bf9MwBgJN8w/5WfUFprBqSgJ

https://stackoverflow.com/questions/34450497/removing-polyline-in-cesium-js  Used

https://groups.google.com/forum/#!msg/cesium-dev/SLGGF3kpp_4/MvLRLVku42AJ

https://developers.google.com/web/fundamentals/primers/promises

Share

GeoJSON FeatureCollection example, geometry and properties.

        $str = '{
            "type": "FeatureCollection",
            "features": [
            {
                "type": "Feature",
                "geometry": {
                    "type": "Polygon",
                    "coordinates": [[[-69.0062266588211,
                    9.27562217679211],
                    [-43.517945408821106,
                    -2.811371193331128],
                    [-37.014039158821106,
                    -9.795677582829732],
                    [-72.61157142049046,
                    4.701436497353403],
                    [-69.0062266588211,
                    9.27562217679211]]]
                },
                "properties": {
                    "name": "DOUBLE OAKS CENTER",
                    "address": "1326 WOODWARD AV"
                }
            },
            {
                "type": "Feature",
                "geometry": {
                    "type": "Point",
                    "coordinates": [
                        -80.837753,
                        35.249801
                    ]
                },
                "properties": {
                    "name": "DOUBLE OAKS CENTER",
                    "address": "1326 WOODWARD AV"
                }
            }
            ]
        }';

http://openlayers.org/en/master/examples/geojson.html
https://google-developers.appspot.com/maps/documentation/utils/geojson/
http://geojsonlint.com/

https://gist.github.com/sgillies/1233327  –  The GeoJSON Format Specification

var viewer = new Cesium.Viewer('cesiumContainer', {
    sceneMode : Cesium.SceneMode.SCENE2D,
    timeline : false,
    animation : false
});

var dataSource = Cesium.GeoJsonDataSource.load('simplestyles.geojson');
viewer.dataSources.add(dataSource);
viewer.zoomTo(dataSource);

Share

Left hand panel for Cesiumjs.


»
$(function(){
	$('.slider-arrow').click(function(){
        if($(this).hasClass('show')){
	    $( ".slider-arrow, .panel" ).animate({
          left: "+=300"
		  }, 700, function() {
            // Animation complete.
          });
		  $(this).html('«').removeClass('show').addClass('hide');
        }
        else {   	
	    $( ".slider-arrow, .panel" ).animate({
          left: "-=300"
		  }, 700, function() {
            // Animation complete.
          });
		  $(this).html('»').removeClass('hide').addClass('show');    
        }
    });

});
.panel {
	width:300px;
	float:left;
	height:550px;
	background:#d9dada;
	position:relative;
	left:-300px;

}
.slider-arrow {
	padding:5px;
	width:10px;
	float:left;
	background:#d9dada;
	font:400 12px Arial, Helvetica, sans-serif;
	color:#000;
	text-decoration:none;
	position:relative;
	left:-300px;
}

https://jsfiddle.net/phpmind/2gj84235/

Share

Displaying dynamic CZML data?

var czml = [{
    "id" : "document",
    "name" : "CZML Model",
    "version" : "1.0"
}, {
    "id" : "aircraft model",
    "name" : "Cesium Air",
    "position" : {
        "cartographicDegrees" : [-77, 37, 10000]
    },
    "model": {
        "gltf" : "../../SampleData/models/CesiumAir/Cesium_Air.glb",
        "scale" : 2.0,
        "minimumPixelSize": 128
    }
}];


var updatedCzml = [{
    "id":"document",
    "name":"CZML Model",
    "version":"1.0"
},{
    "id":"aircraft model",
    "position": {
        "cartographicDegrees":
        [-139.23640674352512,24.89787519772953,48897.796695947756]
    }
}];


var czmlStream = new Cesium.CzmlDataSource();


var viewer = new Cesium.Viewer('cesiumContainer', {
        infoBox : false,
        selectionIndicator : false,
        shadows : true,
        automaticallyTrackDataSourceClocks : false
});

viewer.dataSources.add(czmlStream.load(czml));


Sandcastle.addToolbarButton('Process', function() {
    czmlStream.process(updatedCzml);


});


https://www.html5rocks.com/en/tutorials/eventsource/basics/#toc-security

https://www.howopensource.com/2014/12/introduction-to-server-sent-events/

Source – Hannah Pinkos

Share

Cesium – How to show pyramid with polygon base in CZML ?


    var czml = [
      {
        "id" : "document",
        "name" : "CZML Geometries: Polygon",
        "version" : "1.0"
      }, {
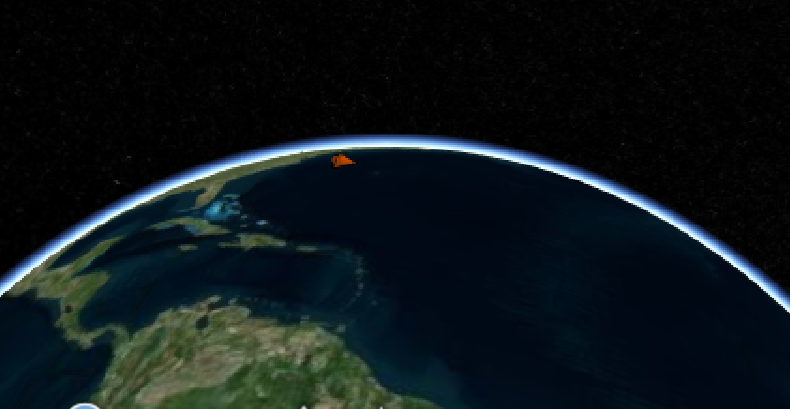
        "id" : "orangePolygon",
        "name" : "Orange polygon with per-position heights and outline",
        "polygon" : {
          "positions" : {
            "cartographicDegrees" : [
              -70.0, 35.0, 100000,
              -72.0, 37.0, 0,
              -68.0, 35.0, 0
            ]
          },
          "material" : {
            "solidColor" : {
              "color" : {
                "rgba" : [255, 100, 0, 100]
              }
            }
          },
      "extrudedHeight" : 0,
      "perPositionHeight" : true,
      "outline" : true,
      "outlineColor" : {
        "rgba" : [0, 0, 0, 255]
      }
    }
  },


    {
    "id" : "orangePolygon2",
    "name" : "Orange polygon with per-position heights and outline",
    "polygon" : {
      "positions" : {
        "cartographicDegrees" : [
          -70.0, 35.0, 100000,
          -70.0, 33.0, 0,
          -68.0, 35.0, 0
        ]
      },
      "material" : {
        "solidColor" : {
          "color" : {
            "rgba" : [255, 100, 0, 100]
          }
        }
      },
      "extrudedHeight" : 0,
      "perPositionHeight" : true,
      "outline" : true,
      "outlineColor" : {
        "rgba" : [0, 0, 0, 255]
      }
    }
  },

    {
    "id" : "orangePolygon3",
    "name" : "Orange polygon with per-position heights and outline",
    "polygon" : {
      "positions" : {
        "cartographicDegrees" : [
          -70.0, 35.0, 100000,
          -70.0, 33.0, 0,
          -72.0, 37.0, 0,
        ]
      },
      "material" : {
        "solidColor" : {
          "color" : {
            "rgba" : [255, 100, 0, 100]
          }
        }
      },
      "extrudedHeight" : 0,
      "perPositionHeight" : true,
      "outline" : true,
      "outlineColor" : {
        "rgba" : [0, 0, 0, 255]
      }
    }
  }
];

var viewer = new Cesium.Viewer('cesiumContainer');
var dataSource = Cesium.CzmlDataSource.load(czml);
viewer.dataSources.add(dataSource);
viewer.zoomTo(dataSource);

Share

Cesium – How to show multiple polylines using czml ?

var czml = [
  {
    "id" : "document",
    "name" : "CZML Geometries: Polyline",
    "version" : "1.0"
  },
  {
    "id" : "redLine",
    "name" : "Red line on the surface",
    "polyline" : {
      "show": false,
      "positions" : {
        "cartographicDegrees" : [
          -75, 35, 0,
          -125, 35, 0
        ]
      },
      "material" : {
          "polylineOutline": {
              "color": {"rgba": [255, 0, 0, 255]},
              "outlineColor": {"rgba": [255, 255, 255, 255]},
              "outlineWidth": 2.0
          }
      },
      "width" : 5
    }
  },
  {
    "id" : "purpleLine",
    "name" : "Purple straight line at height",
    "polyline" : {
      "show": false,
      "positions" : {
        "cartographicDegrees" : [
          -125, 35, 0,
          -170, 35, 0
        ]
      },
      "material" : {
          "polylineOutline": {
              "color": {"rgba": [148, 0, 211, 255]},
              "outlineColor": {"rgba": [255, 255, 255, 255]},
              "outlineWidth": 2.0
          }
      },
      "width" : 5
    }
  }
];

var viewer = new Cesium.Viewer('cesiumContainer');
var dataSource = new Cesium.CzmlDataSource();
dataSource.load(czml);
viewer.dataSources.add(dataSource);
viewer.zoomTo(dataSource);

var handler = new Cesium.ScreenSpaceEventHandler(viewer.scene.canvas);
handler.setInputAction(
    function () { 
        dataSource.entities.getById('purpleLine').polyline.show = true;
        dataSource.entities.getById('redLine').polyline.show = true;

    },
    Cesium.ScreenSpaceEventType.LEFT_CLICK
);

By : https://github.com/AnalyticalGraphicsInc/cesium/issues/3598

Share

Cesium – How to make an InfoBox pop up on demand ?

                              .....
                           .'       '.
                          .           .
                          :           :
                          '           '
                ,.*====.   '.       .'   .====*.,
               .-`"/c)}}},    :...:    ,{{{(c\"`-.
           _.-'-6>   {{{{{'''`     `'''}}}}}   <9-'-._
          t         |}}}}}}           {{{{{{|         y
           \__.___.'{{{{{{{           }}}}}}}'.___.__/
               `[__/}}}}}}}}         {{{{{{{{\__]`
                {{{.'     `'-._   _.-'`     '.}}}
                }}/            ```            \{{
                {{|                           |}}
                }}|                           |{{
         .------{{{\    ,               ,    /}}}------.
        //.--------'    ;               ;   '---------.\\
       ((///  _          \             /          _  \\\))
 jgs    (((--' `''-------'`'"'-----'"'`'-------''` '--)))

It’s a bit of a hack, but you can make the info popup display whatever you like by creating a fake entity and setting it as the viewer’s selected entity. For example:

var entity = new Cesium.Entity('Title to put in the infobox');
entity.description = {
    getValue : function() {
        return 'HTML to display in the infobox';
    }
};
viewer.selectedEntity = entity;
Share

Cesium – How to Improve InfoBox ?

In order to run a script in the infobox, you have to enable scrips to run in the iframe. This is disabled by default for security reasons, in case you don’t know the source of the data populating the infobox.
You can enable scrips with this code:

var iframe = document.getElementsByClassName('cesium-infoBox-iframe')[0];
iframe.setAttribute('sandbox', 'allow-same-origin allow-scripts allow-popups allow-forms'); 

Also, to get the current value of an entity property, you can use .getValue(viewer.clock.currentTime);

Share